Traffic Scenarios
Scenario Definition
A scenario for PAMINA is a tested setup of files usually comprising the following components:
- a set of network files
- an initial route file
- a makefile
- a Pamina configuration
- Gnuplot evaluation files
A scenario comes as a gzipped tar archive and must be installed into the scenarios subdirectory of the Pamina main directory.
Available Scenarios
Braess Paradox
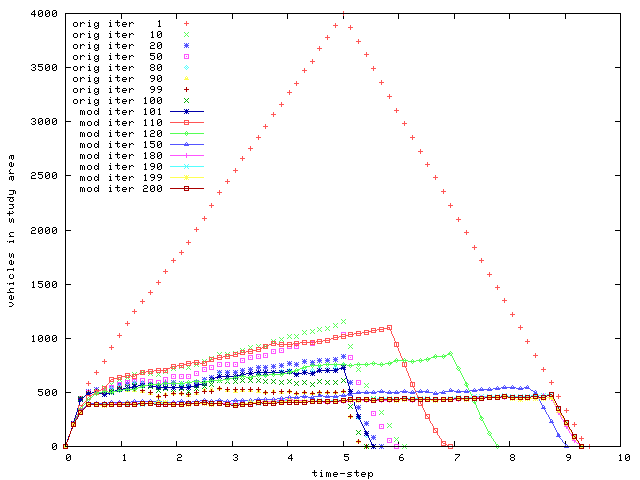
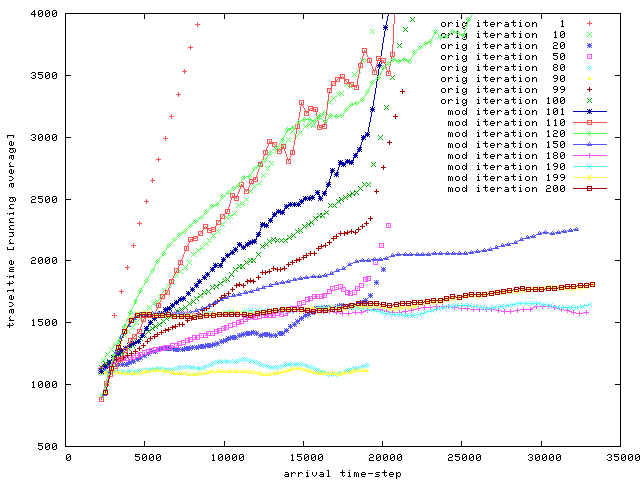
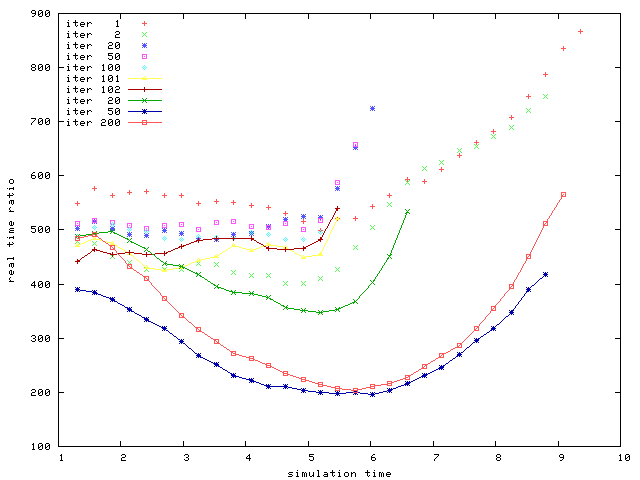
This scenario contains a simple network in two different versions. The “original” network offers two equivalent alternative routes for going from A to B. On each alternative the vehicles have to go through a short stretch of road with a small capacity and a longer road with a large capacity. After re-planning the stream of vehicles is distributed more or less equally onto the two alternatives. After the system has reached equilibrium the network is modified to include a third alternative. A vehicle taking that route has to travel a much shorter distance reducing its travel time noticeably. Unfortunately, it has to go through BOTH stretches of low capacity of the first two alternatives. That way, the load on these two stretches are pushed above capacity and after re-planning the overall performance measured as the mean travel time of all vehicles is actually reduced. For a more detailed description of this paradox please see here.
Routing Statistics
Travel Time Statistics
Performance Statistics
Dallas / Fort Worth Study Area
In this scenario the route planning is done for the complete network of the Dallas/Fort Worth metropolitan area based on an initial route set used in the TRANSIMS case study. Permission to use the street maps and the initial route plan was granted by Mr. Ken Cervenka of the North Central Texas Council of Governments on April 14th, 2005.
The routes of this route set are “trimmed” to the extent of the actual simulation area comprising a rectangle of approximately 11 by 13 kilometers and 2276 lane kilometers (resulting in 303500 CA sites).
During the initial iteration we do complete planning for all routes in the set based upon the free speeds of the street links. Then, we do 49 iterations with a re-planning fraction of 5%, each time feeding back the actual travel times of the street links of the previous iteration. We see a drastic improvement of the throughput of the network as the iterations go on.
Routing Statistics
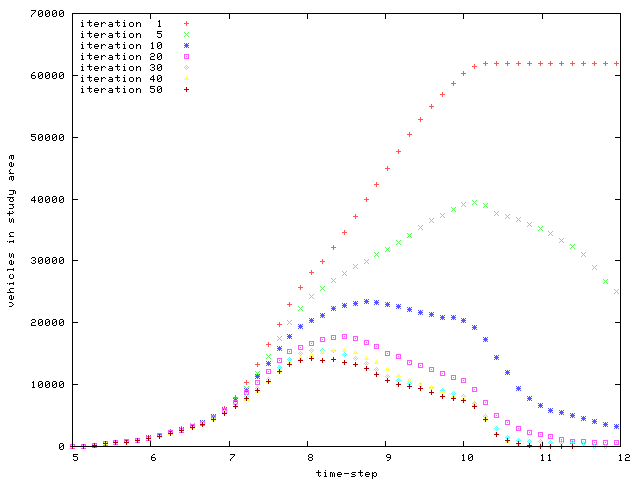
The figure above shows the number of vehicles in the study area by simulation time. During the initial iteration the traffic conditions produced by the route set based on free speeds are disastrous: some traffic jams never dissolve so that at the end of the simulation period there are still more than 60.000 vehicles in the system. After only 5 iterations this number has decreased to less than 30.000 vehicles. After 50 iterations there are no vehicles left at the end of the simulation and maximum number has decreased to a reasonable 14.000 vehicles.
Travel Time Statistics
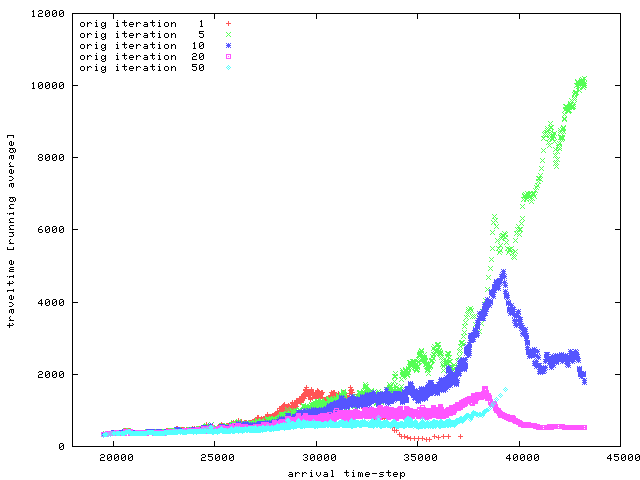
The figure above shows how the average travel time of the drives improve over the iteration. Note that you only routes that have actually completed are considered. This is why the curve for the initial iteration seems to be rather good. However, for this iteration there are hardly any vehicles leaving the system. Also note that even for the final iteration there seem to be some traffic jams which only dissolve at about 10:00 AM resulting in a rather steep increase at the end of the curve.
Performance Statistics
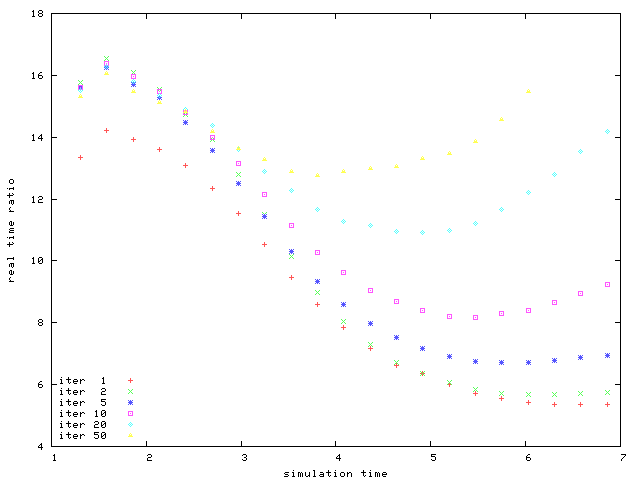
The figure above basically shows two computational aspects.
- First, the comparison between the initial and the second iteration yields an improvement for early simulation time (e.g. 8.30 AM; the x coordinate starts at 5:00 AM). This is due to the execution time feedback into the partitioning of the network onto CPN. Whereas for the first iteration the execution times of links were bases simply on their lengths, during the second iteration the actual execution times of the previous iteration were used.
- Second, the graph shows that the execution time of the cellular automaton traffic model is largely independent of the load of the street network: the real time ratio at the end of the simulation only varies by a factor of approximately three although the number of vehicles in the system varies from more or less zero to more than 60.000.
Downloads
| Name | Available Since Version | Latest Update | File Size | Link |
|---|---|---|---|---|
| Braess Paradoxon | 0.9 | 04/30/2005 | 6.254 | BraessParadox.tgz |
| Dallas / Fort Worth Study Area | 0.9.1 | 04/30/2005 | 77.224.415 | available upon request |